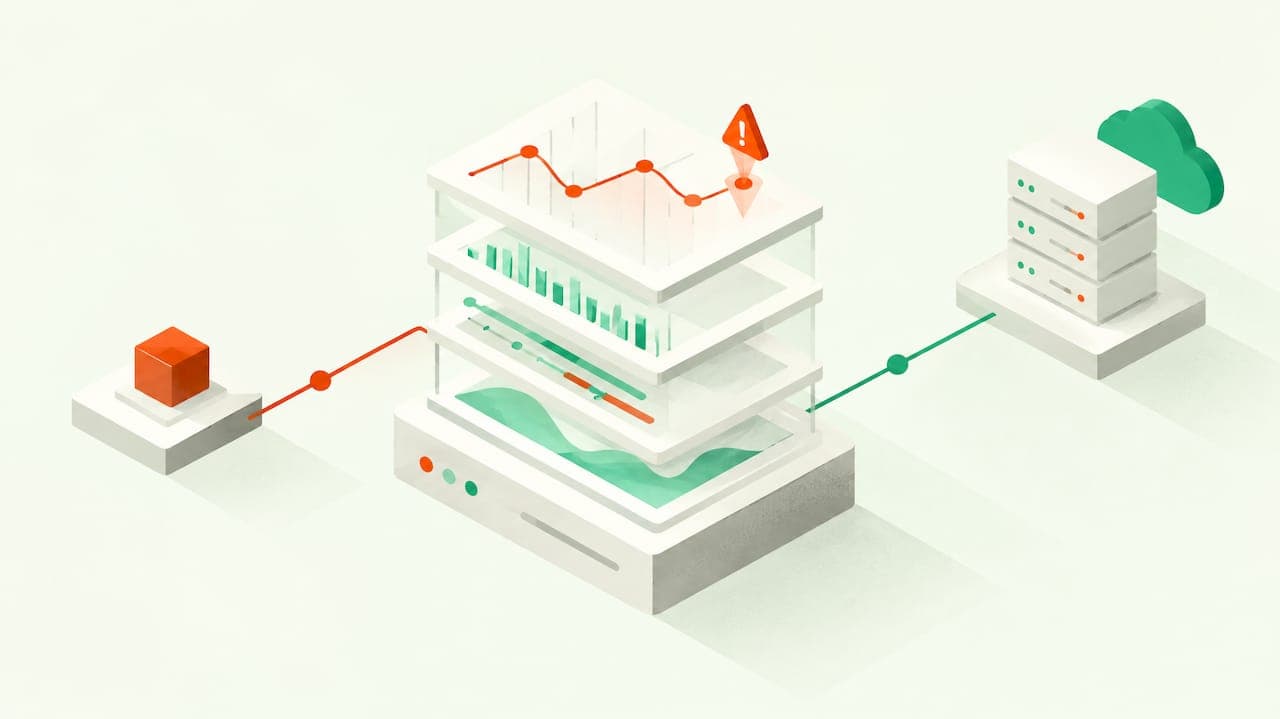
Monitor four signals in every Rails app: database queries and N+1 patterns, request latency at p95 and p99, background job health, and unhandled exceptions. Instrument with ActiveSupport::Notifications for Rails-native events, add OpenTelemetry for portable tracing, and correlate errors with traces so a spike points to a cause, not just a symptom. Start in staging, sample traces before you widen them in production, and route everything to one dashboard.
TL;DR:
- Monitoring query duration and connection pool usage helps catch slow database operations and prevent request queuing before user issues arise.
- Building dashboards that display request latency percentiles, slow route data, and background job trends enables rapid identification of bottlenecks and degraded performance.
- Sample traces at around 10-20% in staging and only widen collection in production after thresholds are tuned to avoid unnecessary overhead and costs.
- Alerts should focus on percentage jumps in latency or error rates rather than fixed thresholds, with tagging deployed code versions to identify recent changes causing issues.
- Using OpenTelemetry and structured, correlated logs improves traceability and faster root cause analysis across both performance and security-related incidents.
Table of Contents
- What to monitor in a Rails app: concrete checklist
- How to instrument Rails: ActiveSupport, OpenTelemetry, and monitoring gems
- Visualization and alerting: dashboards and actionable alerts
- Rollout, overhead, retention, and Rails version compatibility
- Enkihost perspective: how hosting choices affect monitoring
- Logging best practices and integration with monitoring tools
- Security monitoring such as protection against injection and CSRF attacks
- Monitoring external API calls and third-party service latency
- What actually matters once you start monitoring Rails apps
- Enkihost: a managed hosting option for Ruby apps
- FAQ
- Sources
- Primary documentation and implementation links
What to monitor in a Rails app: concrete checklist
Before picking a tool, know what you are actually trying to see. Rails apps fail in a handful of predictable ways, and each one leaves a different fingerprint.
Start with the database, since it is where most Rails slowdowns originate. Watch queries per request, flag anything resembling an N+1 pattern, and treat any query running past 100 milliseconds as worth a second look. Connection pool usage matters just as much: a pool that is constantly maxed out will quietly queue requests behind the scenes long before anyone files a bug report.
Request latency comes next. Average response time hides the problem; percentiles reveal it.
- Track median latency for the typical experience and higher percentiles to capture what slower users feel and what outliers experience, as these usually signal real issues.
- Build request trace waterfalls so you can see exactly where time goes: view rendering, database calls, external API waits.
- Watch throughput alongside latency, since a drop in both often means something upstream is broken, not just slow.
- Flag background job queue depth, runtime distribution, and retry counts for Sidekiq or ActiveJob.
- Group exceptions by type and track error rate over time rather than raw counts.
According to Rails Pulse, effective Rails monitoring hinges on four critical areas: database query performance and N+1 detection, request latency percentiles, background job health, and unhandled exception rates. That is a useful filter when you are deciding what deserves a dashboard tile and what can live in the logs.
System-level indicators round things out: CPU, memory, garbage collection pauses, and open database connections. None of these tell the whole story alone, but together they explain why a seemingly healthy app starts timing out under load.
How to instrument Rails: ActiveSupport, OpenTelemetry, and monitoring gems
Rails already ships with most of what you need. ActiveSupport::Notifications is the framework's built-in instrumentation API, and it fires events like process_action.action_controller and sql.active_record without any extra gem.
- Subscribe to
process_action.action_controllerfor full request timing, including view and database breakdowns. - Subscribe to
sql.active_recordto catch slow or repeated queries as they happen. - Use
monotonic_subscribeinstead ofsubscribefor timing-sensitive events, since it avoids wall-clock drift from system time changes. - Keep subscriber logic lightweight; heavy synchronous work inside a callback slows down the very request you are trying to measure.
For portability across backends, OpenTelemetry for Ruby adds a vendor-neutral tracing layer. A typical setup lives in config/initializers/opentelemetry.rb:
OpenTelemetry::SDK.configure do |c|
  c.use_all
end
c.use_all enables every available instrumentation gem it detects, which is convenient to start but worth narrowing down once you know which libraries actually matter for your app. Exporters are swappable: use the console exporter while testing locally, then switch to OTLP once you are shipping traces to a real backend.
A separate decision is where that telemetry lives. Self-hosted engines like Rails Pulse and Railswatch store everything in your own application database, which keeps infrastructure simple and data private, though it means watching table growth and retention. Sending traces to a hosted APM instead trades that operational simplicity for a dedicated backend built for querying at scale. Neither is wrong, but pick one deliberately rather than defaulting into whichever gem you found first.
Visualization and alerting: dashboards and actionable alerts
Collecting data is the easy part. Making it useful means building a handful of dashboards that answer specific questions fast.
- A latency histogram showing the full p50 to p99 spread, not just an average.
- A slow requests table sorted by p95, so the worst offenders surface immediately.
- A top routes table ranked by database time, since that is usually where the fix lives.
- A job queue trend chart showing depth and retry rate over the last few hours.
Alerts should fire on change, not just on absolute thresholds. A 30% jump in p95 latency over your rolling baseline matters more than a fixed number that might be normal for your traffic pattern. Pair that with an error-rate spike threshold, a Sidekiq queue depth ceiling, and a rule that flags anything correlated with a recent deploy timestamp.
Pro Tip: Tag every trace and log line with the current deploy SHA. When an alert fires, you will know in seconds whether it lines up with something you just shipped.
Root cause work goes faster when traces, logs, and metrics share a common identifier, usually a request ID, so you can jump from a graph spike straight to the exact trace and its related log lines. Whether you lean on a hosted APM dashboard or build your own with Grafana and Prometheus comes down to team size and appetite for running infrastructure. Hosted tools save setup time; a self-managed stack gives you more control over retention and cost at scale.
Rollout, overhead, retention, and Rails version compatibility
Instrumentation is not free, so roll it out with a plan rather than flipping it on everywhere at once.
- Deploy instrumentation to staging first and measure the overhead directly, since even a few extra milliseconds per request compounds at scale.
- Apply trace sampling (start around 10 to 20% of requests) before going to production, keeping full metrics collection separate from sampled traces to control storage cost.
- Decide retention upfront: traces are expensive to store in full, so keep them sampled, while aggregate metrics can reasonably live longer at low cost.
- Confirm your instrumentation libraries support your current Rails version. Rails has published end-of-support dates, with supported versions now at 7.2.x, 8.0.x, and 8.1.x, so an app still running 7.0 or 7.1 should prioritize upgrading before adding new tooling on top.
- Widen trace sampling only after your dashboards and alert thresholds have been tuned against real production data.
Enkihost perspective: how hosting choices affect monitoring
Deploy noise is one of the most common false alarms in Rails monitoring: a latency spike that is really just a slow restart, not a real problem. Our hosting includes zero-downtime deploys specifically designed to remove that category of incident, so the spikes your dashboards do show are worth investigating. Resource isolation per app also means one noisy neighbor's traffic burst stops showing up as unexplained jitter in your own metrics.
Managed hosting tends to make the most sense for small teams and indie hackers who would rather spend evenings shipping features than tuning infrastructure. Larger teams with dedicated ops staff often prefer to self-host telemetry for full control over retention and cost.
Logging best practices and integration with monitoring tools
Logs and metrics answer different questions, and conflating them is a common mistake. Metrics tell you something is wrong; logs tell you why.
Structure your logs as JSON from the start rather than retrofitting it later. A structured log line with request ID, user ID, and controller action attached turns a grep session into a filtered query. Rails' built-in tagged logging can attach a request ID automatically, which becomes the thread that ties a log line back to a specific trace.

Keep log levels disciplined: info for request lifecycle events, warn for recoverable issues like a retried job, and error reserved for actual failures that need attention. A codebase that logs everything at error trains everyone to ignore error-level alerts, which defeats the purpose.
Where logging earns its keep is integration. Shipping logs to the same backend as your traces and metrics means a single request ID can pull up the full story: the trace showing where time went, the metric showing it was part of a broader spike, and the log line showing the exact exception message and stack trace. Without that correlation, you end up with three separate tools and no fast way between them.
Security monitoring such as protection against injection and CSRF attacks
Monitoring is not only about speed and uptime. Catching an attempted attack early is just as much a part of the job as catching a slow query.
Rails protects against SQL injection by default when you use parameterized ActiveRecord queries, but raw SQL fragments or string interpolation in a where clause reopen that door. Watching for unusual query patterns, especially ones with suspicious characters in parameters, is a reasonable early warning signal worth adding to your logging pipeline.
CSRF protection is enabled by default in Rails through protect_from_forgery, and a spike in CSRF token verification failures is worth alerting on rather than silently discarding. A sudden rise usually means either a broken frontend integration or someone probing for a weakness, and the only way to tell the difference is to look.
Rate limiting unusual request patterns, particularly repeated failed authentication attempts from the same source, belongs in the same monitoring layer as your performance metrics. Treat a burst of 401s the same way you would treat a latency spike: as a signal worth a dashboard tile and an alert, not just a log line nobody reads until after the fact.
Monitoring external API calls and third-party service latency
Your app's reliability is only as good as the slowest third-party service it depends on. A payment processor having a bad afternoon can make your entire checkout flow look broken, even though your own code never changed.
Instrument outbound HTTP calls the same way you instrument database queries: capture duration, status code, and the specific endpoint being called. This is one area where OpenTelemetry's auto-instrumentation for common HTTP libraries saves real setup time, since it wraps outbound calls without requiring you touch every integration point by hand.
Set separate latency thresholds for third-party calls than you would for your own database, since network round trips to another company's servers are inherently less predictable. A timeout and retry strategy, with circuit breaking for services that are clearly down, keeps one failing dependency from cascading into a full outage. Track these calls on their own dashboard panel rather than folding them into general request latency. A 2-second request that spent 1.8 seconds waiting on a third-party API tells a completely different story than one that spent that time in your own database, and your monitoring should make that distinction obvious at a glance.
What actually matters once you start monitoring Rails apps
Most teams over-invest in dashboards and under-invest in alert quality. A beautiful Grafana setup that pages nobody when p95 latency doubles is decoration, not monitoring. The conventional advice to "instrument everything" sounds responsible but usually produces so much noise that real signals get lost in it.
Prioritize in this order: unhandled exceptions first, since they represent concrete broken experiences, then request latency percentiles, then background job health. N+1 detection deserves more attention than most teams give it, since it is often the single highest-leverage fix available, quietly degrading performance across dozens of endpoints at once.
The self-hosted-versus-hosted-APM debate gets more airtime than it deserves. Pick whichever keeps you looking at the data regularly. A self-hosted gem you actually check every day beats a feature-rich APM dashboard gathering dust behind a login nobody remembers the password to.
— Albert
Enkihost: a managed hosting option for Ruby apps
Monitoring tells you what is wrong; good hosting prevents a chunk of those problems from happening in the first place. We offer hosting aimed at Ruby developers, with zero-downtime deploys designed to eliminate restart-related noise in latency graphs, automated database provisioning to reduce connection-pool misconfiguration, and resource isolation to prevent one app's traffic spike from causing jitter in another.

- Zero-downtime deploys help ensure deploy events do not masquerade as incidents on your dashboards.
- Automated PostgreSQL and Redis provisioning, with practical defaults from the start.
- Resource isolation to support consistent performance under load.
This fits indie hackers and small startups who want fewer moving parts to monitor in the first place. Check Spark, Ignite, and Blaze to see which plan fits your app, with a 14-day free trial to test it against your own workload.
FAQ
What is a Rails app?
A Rails app is a web application built on Ruby on Rails, a server-side framework that follows the model-view-controller pattern and emphasizes convention over configuration. It handles routing, database interaction through ActiveRecord, and view rendering, which is why monitoring a Rails app means watching those same three layers for slowdowns.
Is Rails still relevant?
Yes, Rails continues to receive active development and official support, with the project regularly publishing new releases and support timelines for current versions like 7.2.x, 8.0.x, and 8.1.x. Ongoing maintenance and a mature ecosystem of monitoring and deployment tooling are strong signals that the framework remains a practical choice for new projects.
Is GitHub still a Rails app?
GitHub's core platform has long been built on Ruby on Rails, and the company has publicly discussed its continued investment in the framework rather than migrating away from it. Exact architecture details change over time, but Rails remains central to how the platform is described publicly.
What will Ruby on Rails be like in 2026?
Based on the project's own release pattern, expect continued point releases building on the 8.x line, with support maintained for 7.2.x, 8.0.x, and 8.1.x and older versions like 7.0 and 7.1 reaching end of life. Teams still running unsupported versions should plan an upgrade path, since instrumentation and monitoring gems increasingly target current releases first.
Should I use a self-hosted monitoring gem or OpenTelemetry?
Self-hosted gems like Rails Pulse store telemetry directly in your app database, which keeps setup simple and data private but requires watching table growth over time. OpenTelemetry trades that simplicity for vendor-neutral tracing that can export to multiple backends, which suits teams expecting to scale their observability stack beyond a single app.
Sources
- Rails Pulse — Observability for Rails
- Active Support Instrumentation — Ruby on Rails Guides
- OpenTelemetry Ruby — Getting started
- railspulse/rails_pulse — GitHub
- Rubyonrails